The following is text from the U.S. Coast Guard blog Maritime Commons:
(WASHINGTON) — Two weeks ago, the Coast Guard met with the American Waterways Operators (AWO) for a National Quality Steering Committee meeting. During the meeting, the Coast Guard provided the safety report, "Towing Industry Safety Statistics: 1994-2014." These measures are presented annually and considered to be useful indicators of industry trends.
Maritime Commons attended the AWO meeting and is providing a summary of the key takeaways and charts from the report for your informational purposes…
Towing industry safety statistics report
For 15 years, the National Quality Steering Committee has used metrics to track overall trends in safety and environmental protection. These provide useful indicators of towing industry trends. Measures discussed during the AWO meeting covered here:
• Crew fatality rate
• Oil spill volumes
• Oil spill rate
• Vessel incidents
• Crewmember injuries
Crew fatality rate
In 2014, there were four crew fatalities, which is the lowest number on record. There were a total of eight deaths reported to the Coast Guard but only four were directly related to towing vessel operations. Three were the result of crewmembers falling into the water and the fourth was a result of a crane barge striking a bridge, which caused the crane to collapse on the pilothouse of the vessel.
This chart shows the annual fatality count, the linear trend line, and the five-year moving average for calendar years 1994 through 2014.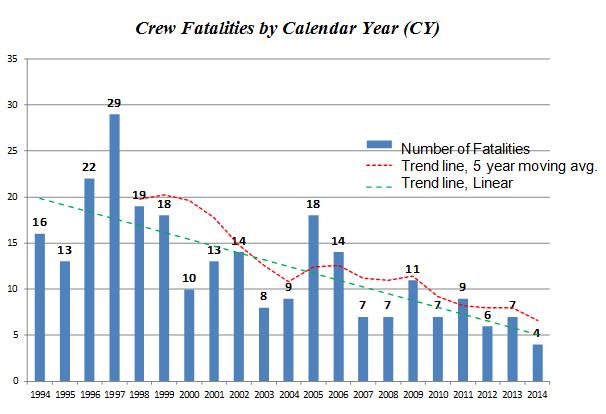
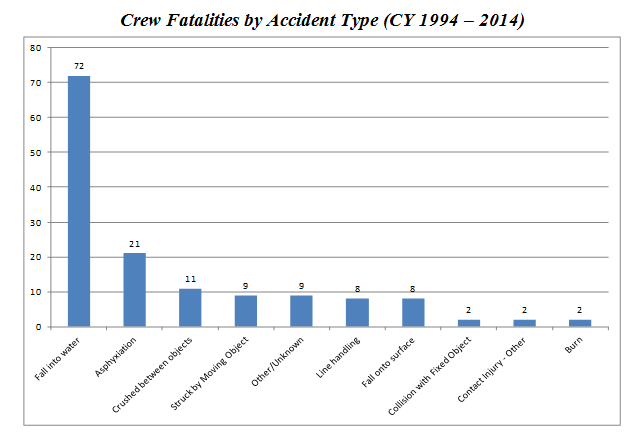
Here is a chart of crew fatalities by accident type. The largest number of crew fatalities is attributed to falls overboard (72 of 144 or 50 percent). The next largest group of fatalities is attributed to asphyxiation.
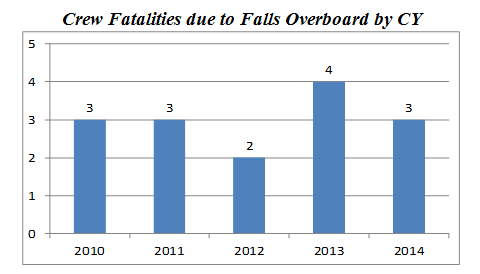
The chart below shows the number of fatalities resulting from falls overboard for 2010 to 2014. While the number of annual fatalities for all accident types has gone down over the last five years, the number due to falls overboard has remained nearly constant.
Oil spill volumes
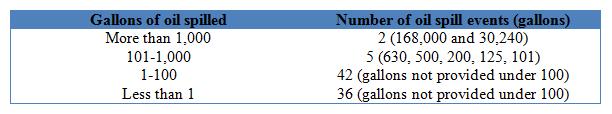
According to Coast Guard records, an estimated 200,363 gallons of oil was spilled as a result of 85 tank barge pollution incidents in 2014. The largest oil spill of 168,000 gallons was 84 percent of the volume spilled in 2014. The second largest spill of 2014 was 15 percent of the total volume spilled.
*These two spills accounted for 99 percent of the total volume of oil spilled from tank barges for 2014.
Here is a table that depicts the gallons of oil spilled from tank barges in 2014:
Oil spill rate
Based on Army Corps of Engineer data, the oil spill rate for 2014 was projected to be approximately one gallon of oil spilled per 373,000 gallons transported, or 2.68 gallons of oil spilled per million gallons transported.
For 2013, the ACOE reported 273.1 million short tons, or approximately 74.9 billion gallons of oil transported by barge on U.S. waterways*. That amount represents 83 percent of all oil carried on domestic waterways. The amount of oil transported by barge in 2013 increased by 20.7 million short tons or 5.7 billion gallons. This represents a 7.6 percent increase over 2012.
* Reference: http://www.navigationdatacenter.us/wcsc/pdf/wcusnatl13.pdf
![]()
While there has been an increase of 7.6 percent in the amount of oil transported by barge from 2012 to 2013, the projected oil spill rate of 2.68 for 2014 is still very low given the number of volume transported. Further, as noted previously, two marine casualties are responsible for 99 percent of the total volume spilled for 2014.
Vessel incidents
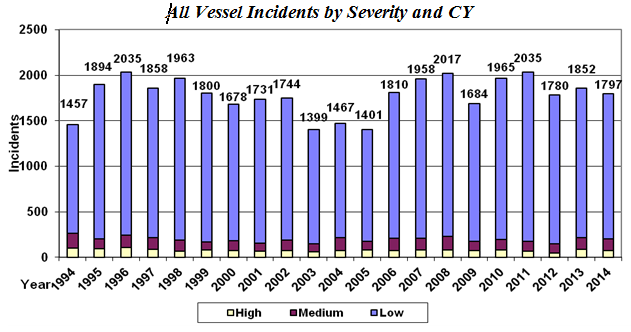
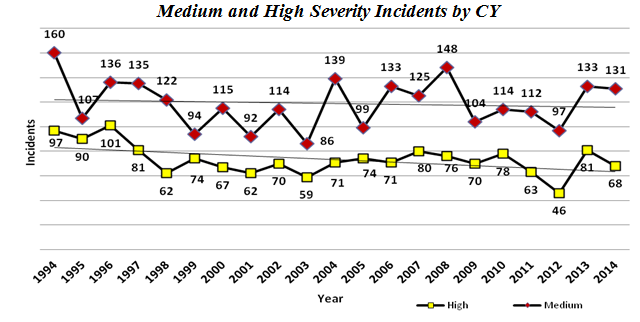
Towing vessel incidents include all reportable marine casualties that involved any towing vessel or barge. Each incident is only counted once, regardless of the number of vessels involved. In 2014, 89 percent of towing vessel casualties were of the low severity type. Medium and high represented 7 percent and 4 percent of all incidents respectively. There was a slight decrease in all incidents, to include medium and high severity incidents between 2013 and 2014.
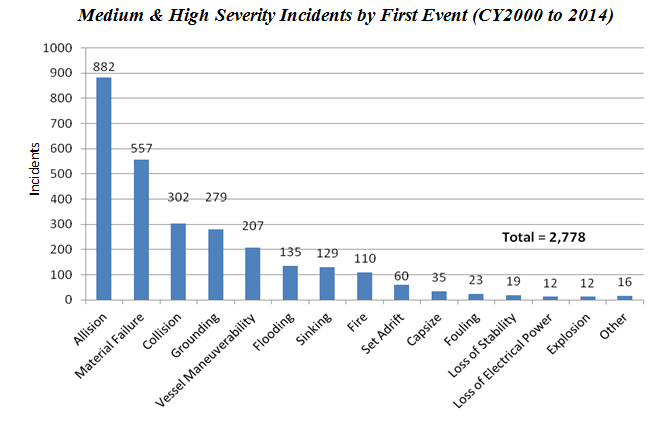
*Something to note about the chart below is that 32 percent of medium and high severity incidents began with an allision and material failure was the first event in 20 percent of marine casualties.
Crewmember injuries
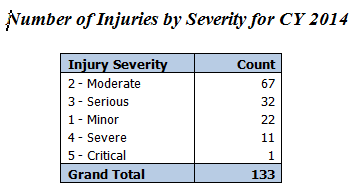
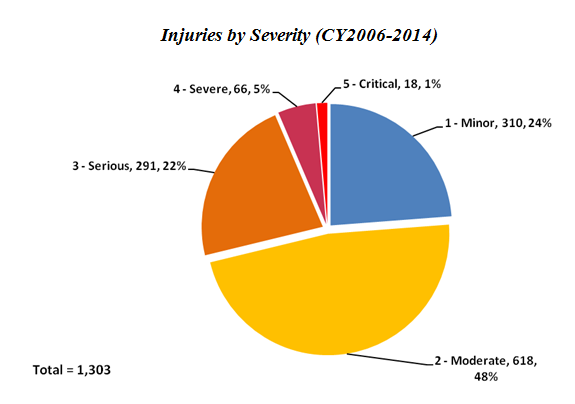
In 2005, the Coast Guard began documenting injury severity with each personnel casualty investigations. In 2014 there were 133 injuries to crewmembers where the “vessel class” or “vessel service” was either “towing vessel” or “barge.” The breakdown of injuries by severity is shown in in the table below where 67 percent of injuries were classified as minor or moderate. In 2013, 68 percent of the injuries were classified as minor or moderate. In comparing serious, severe and critical injuries, there was an increase in these injuries between 2013 and 2014.
The next chart summarizes crewmember injuries by severity, for calendar years 2006-2014. The data continues to show that almost three-quarters of injuries (72 percent) were minor or moderate in severity.
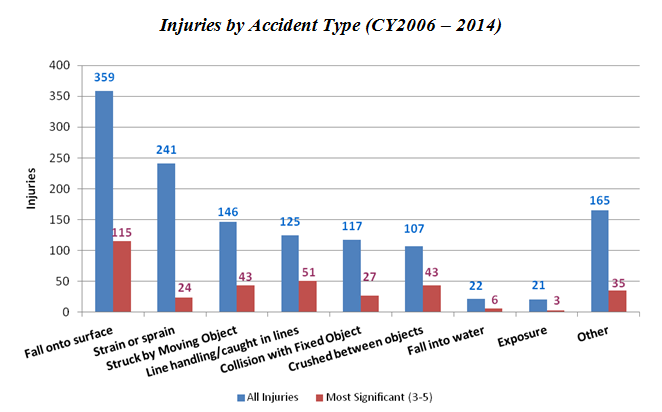
Injury data may also be grouped by type of accident. Four accident types appear to account for most of the higher severity injuries:
• Fall onto surface,
• Line handling/caught in lines,
• Struck by moving object,
• Crushed between objects.
Conclusion
“The original mission of this [AWO and Coast Guard] partnership has matured to a point where we now able to focus not only on safety and the environment but also on how we, together, meet the needs of our nation in terms of maritime transportation,” said Rear Adm. Paul Thomas, assistant commandant for prevention policy. “There is a lot of great work that is ongoing and I look at this is an opportunity to forecast what’s coming and help us anticipate and prioritize that work. We need to look at this and ask where are those places that we might find ourselves in a stern chase if we don’t get out ahead today. The regulatory process can be tough. We need non-regulatory solutions.”